Pete's Log: HTTP 500 Error in SharePoint 2019 After Applying CU
Entry #2498, (SharePoint, Work)(posted when I was 45 years old.)
I recently did some patching to our SharePoint 2019 environment and upon completion, two out of three web front ends were returning HTTP 500 errors to all requests.
I wound up finding a solution but the path there was not straight-forward, so I'm documenting it for my own benefit, plus hopefully making a small contribution towards making the page with the solution more discoverable.
Luckily I still had one working web front end and the load balancer quickly figured out to direct all traffic there.
The Windows event logs and SharePoint ULS logs were both unhelpful. After tracking down a few red herrings, I came to the conclusion I had to look elsewhere. At this point searches for SharePoint and 500 error were not proving fruitful. So I learned how to use a new IIS feature—Failed Request Tracing.
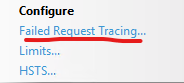
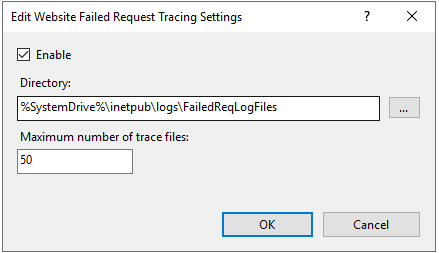
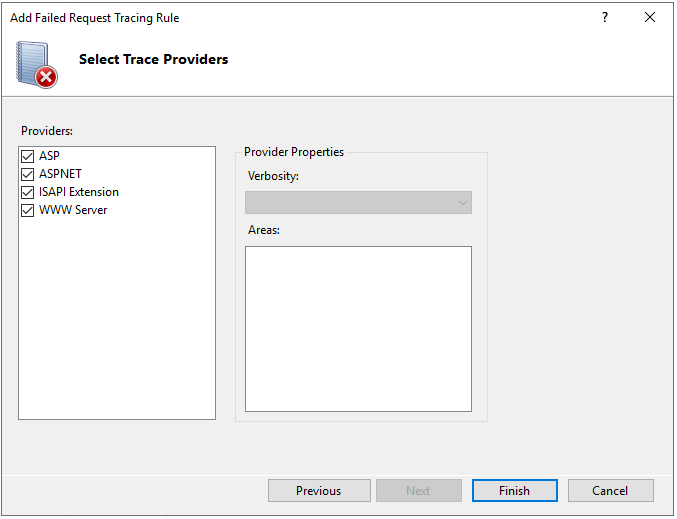
When you have a site selected in IIS, you can enable Failed Request Tracing by clicking "Failed Request Tracing..." under "Configure" on the right panel, then checking "Enable"
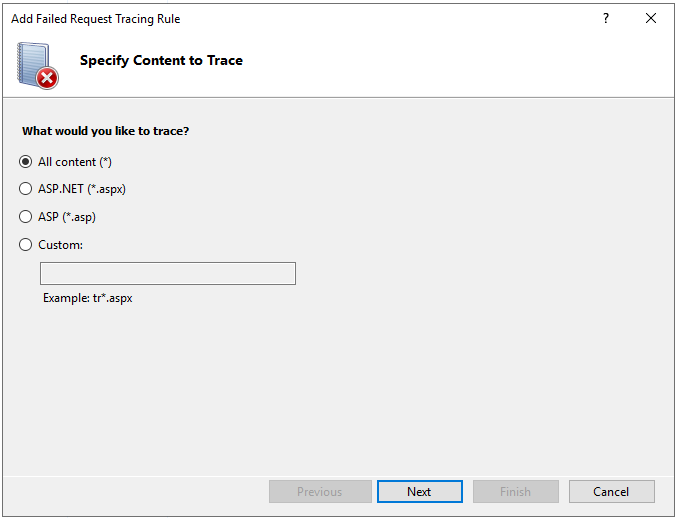
I quickly learned this isn't sufficient for getting a trace, as my FailedReqLogFiles directory remained depressingly empty as I kept reloading the page. You also have to define tracing rules. This is done by clicking the Failed Request Tracing icon in the middle panel, then clicking "Add..." under "Actions" on the right panel.

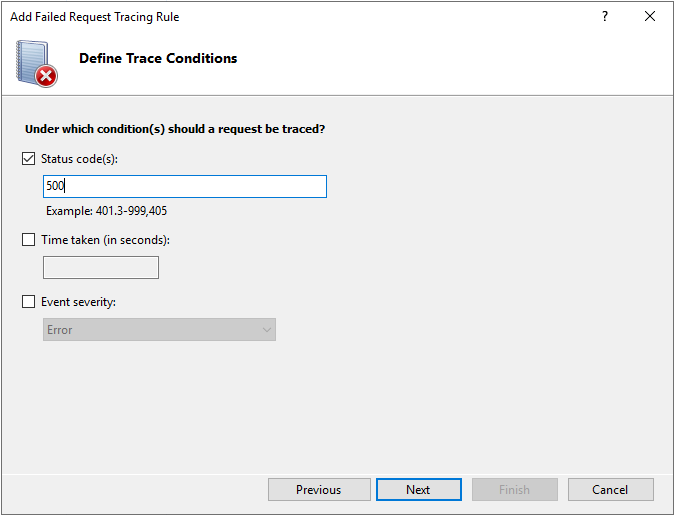
I defined a fairly broad rule, tracing "All content" then defining a condition of Status Code 500 and using all Trace Providers.
After saving my rule and refreshing the page, I was rewarded with a large XML trace file. Reading through that file I finally found a helpful error message.
<EventData> <Data Name="ContextId">{8000007B-0001-EA00-B13F-84210F7967CB}</Data> <Data Name="ErrorDescription">Module "SPRequestFilterModule" could not be found</Data> </EventData>
That message led me to the page linked above.

As described at that page, when I click into the Modules for the SharePoint site, the SPRequestFilterModule had no value in the Code column. I didn't capture my own screenshot of that, but here's what it looks like now. The area circled in red was blank while the error was occurring.
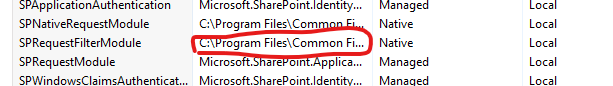
I don't like blindly following instructions without understanding them, so I went to the one web front end that was still working and confirmed that it did have a code value filled in for SPRequestFilterModule.
So using the instruction as a guide, I copied the value filled in on the server that was working and entered it on the two other servers.
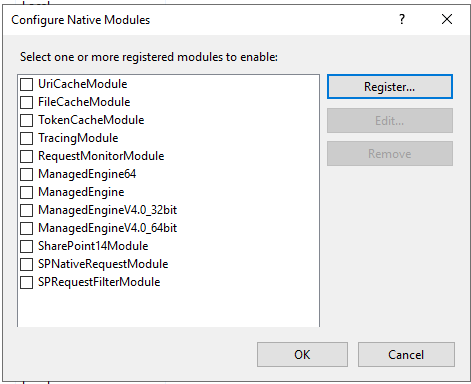
To do so, I clicked onto the server level in the IIS tree, then clicked the "Modules" section, then clicked "Configure Native Modules" under "Actions" on the right panel.
In the screenshot below you can see SPRequestFilterModule at the bottom of the list, but in the error condition, it will be missing.
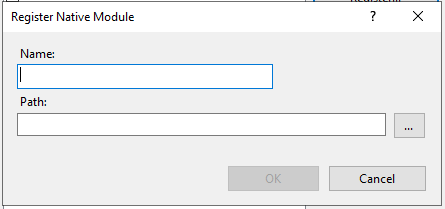
If it is missing, click the "Register..." button, then enter "SPRequestFilterModule" as the Name. For the Path I copied the value from the working server, which is the same path specified at the solution link: "C:\Program Files\Common Files\Microsoft Shared\Web Server Extensions\16\ISAPI\sprequestfilteringmodule.dll"
Thanks Ingo Karstein for the solution.
I had applied the same patch to our test environment a couple weeks previously and not run into this issue. Our test environment only has one web front end, though. The web front end that continued working in production was the first one I patched. So I'm curious if something only goes wrong when the patch is applied to additional servers in the farm.
The CU I was applying is also a different one from the one applied in the linked post. So this may be affecting multiple CUs. I'll see what happens the next time I apply patches.